|
In September 2017, the Department of Employment released its projections for growth in occupational workforces from May 2017 to May 2022. It was predicted that the workforce for ANZSCO Minor Group ‘233 Engineering Professionals’ would grow from 146,200 in 2017 to 159,900 in 2022, an increase of 13,700. This allows a quick calculation of supply and demand for engineers in Australia to be done on a per annum basis. The results are presented in the table below. 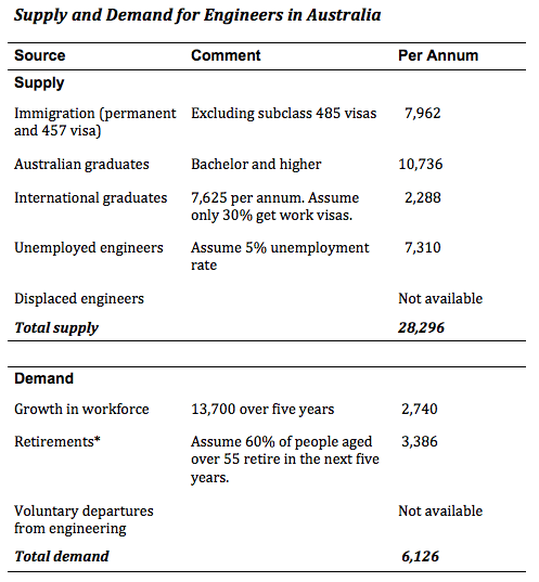 Notes
- Numbers are based on 2015 or 2015-16 data. It is likely that 2017 supply data will be greater. - The total for international graduates assumes only 30% are granted subclass 485 work visas. The actual percentage is likely to be higher. The Government does not release this data. - Some international graduates may obtain a permanent residence visa or a 457 visa within a year of graduation. - An assumed unemployment rate of 5% represents 7,310 engineers. Displacement from the profession is likely to be at least this much. Some unemployed engineers eventually become displaced engineers. - Retirements assume that 19.3% of the workforce is over the age of 55, and that 60% of those over 55 retire in the next five years. The percentage of the engineering workforce aged 55 or over is actually lower (see Table 13 in the report available on this website). 19.3% is the highest reported value for an engineering Unit Group. *Note that redundancies do not create demand because the vacated positions no longer exist by definition. Without accounting for supply from unemployed and displaced engineers or from graduate engineers, and considering only the supply from immigration, it can be seen that with current immigration levels, the supply of migrant engineers would exceed labour market demand by 30% (or 1,836 engineers) each year over the next five years. In reality, there are many thousands of unemployed and displaced Australian engineers seeking engineering positions as well. Add to that more than 13,000 new graduate engineers per annum, and it can be seen that the oversupply of engineers will remain at disastrous levels. Graduates are, of course, not interchangeable with experienced engineers in the engineering workforce. However, if the entire annual demand for 6,126 engineers were only for graduates, then the annual supply of Australian graduates would be 75% greater than demand. Back in 2015, the Department of Employment forecast growth for engineering professionals to be a total of 1,500 from November 2015 until November 2020. Despite this almost no-growth scenario, the Federal Government continued with its program of oversupplying the engineering labour market. The case for doing so then, and now, is indefensible. The only reasonable course of action is to halt engineering immigration until such time as the labour market comes back into balance, allowing unemployed and displaced Australian engineers to be re-absorbed into the workforce. Engineering graduates are coming onto the market in numbers which far exceed labour market demand. To help alleviate this situation, international graduates must no longer be granted work visas. Recently the Department of Employment (DoE) released the results of its 2017 Survey of Employers who have Recently Advertised (SERA). Once again, the engineering profession had the highest number of applicants per vacancy of any profession or trade monitored by the DoE. The number of applicants per engineering vacancy was 48.2 in 2016, falling to 39.9 in 2017. According to DoE, the fall in this number was driven by a lower number of applicants for vacancies for civil engineering professionals. For mechanical engineers, there were 65.9 applicants per vacancy. In stark contrast, the average number of applicants per vacancy for all professions measured was just 13.5. This is additional confirmation of the enormous, ongoing oversupply of the Australian engineering labour market. See:
www.engineeroversupply.weebly.com/applicants and https://docs.employment.gov.au/documents/engineering-professions-australia DoE also recently released its five year projections for the seven Unit Groups in the ANZSCO Minor Group ‘233 Engineering Professionals’. See: www.engineeroversupply.weebly.com/workforce and http://lmip.gov.au/default.aspx?LMIP/GainInsights/EmploymentProjections This forecast, from May 2017 until May 2022, conveys a more positive outlook for engineering occupations than the previous five year forecast released in 2015. The projected compound annual growth rate of the workforce for ANZSCO Minor Group ‘233 Engineering Professionals’ over the next five years is a very modest 1.8% per annum. For the individual engineering Unit Groups, the projections are as follows: 2331 Chemical and Materials Engineers 0.3% per annum 2332 Civil Engineering Professionals 3.8% per annum 2333 Electrical Engineers 0.3% per annum 2334 Electronics Engineers 0.3% per annum 2335 Industrial, Mech. and Prod. Engineers -1.1% per annum 2336 Mining Engineers 1.7% per annum 2339 Other Engineering Professionals 2.1% per annum The predicted workforce growth for '2332 Civil Engineering Professionals' is the largest, and derives from the expected ongoing demand for these professionals in the east coast residential construction boom, and from numerous planned State and Federal Government infrastructure projects. |
